January 05, 2026 · realtime, engineering, infrastructure
The 50ms promise: what it takes to ingest in real time
Under the hood of Vireo's ingest pipeline — how a million events a minute get to your dashboard in under 50 milliseconds, and why it stays that way.
Every page of this site says “under 50ms.” That’s not marketing copy — it’s a number we measure on a dashboard we watch obsessively. Here’s what it takes to keep it honest.
The shape of the pipeline
Events don’t go through a queue where they wait politely. They land at an edge endpoint, get validated and enriched in memory, and stream straight to the hot store that backs your dashboards. There’s no nightly compaction, no batch rollup sitting between “you clicked” and “the chart moved.”
Three pieces matter most:
- The edge. Ingestion points close to the user shave the network leg of the journey.
- The hot path. Queries that back live dashboards hit an in-memory layer, not a disk scan.
- The escape hatch. Everything that doesn’t need to be instant — long-term retention, exports — drains to cold storage without touching the live path.
Why latency quietly decays
Systems don’t start slow; they become slow. A query that used the index, then a join that needed a scan, then a report that scans everything — each step is reasonable, and each one adds up.
We fight decay with two tools:
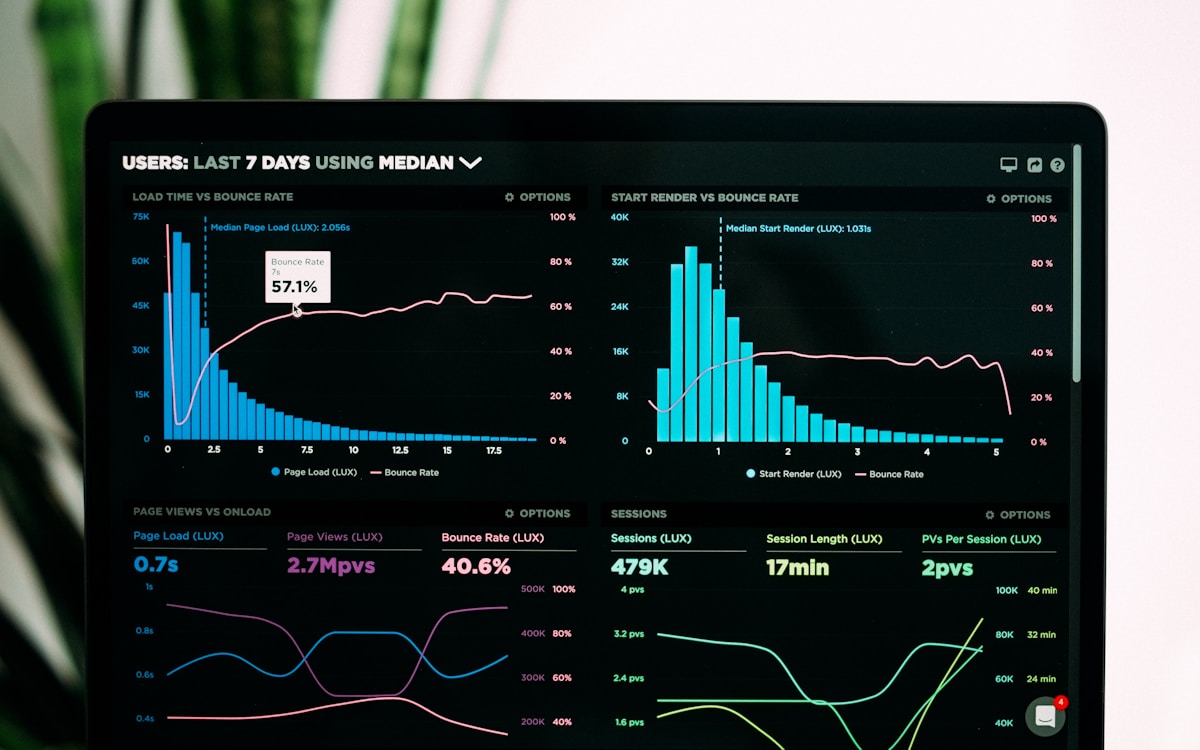
- One dashboard that never lies. The ingest latency chart is on the wall of every on-call rotation. If it creeps past 50ms, it’s an incident, not a blip.
- Load tests that run before launches. Realtime pipelines fail in interesting ways at 10x traffic. We’d rather find that out on a test cluster than during your launch.
What you feel, not what we promise
For you, the difference shows up in behavior, not benchmarks: funnels that move as users move, alerts that fire seconds after the threshold breaks, and support calls that start with “we can see it too.” Real time isn’t a feature you read about — it’s a feeling that your data is alive.
The next time you’re choosing an analytics tool, don’t ask “how fast is it?” Ask “what’s the latency between my user’s action and my dashboard?” That number is the whole product.

Site Reliability at Vireo